How to debug problems on Mobile Safari
When you are developing and/or testing a web app on iOS, having the ability to inspect and understand what is happening in the browser is incredibly useful. For just this reason Mobile Safari can use the same developer tools that are built into Safari on macOS.
To start debugging you’ll need your iOS device, a mac and a lightning cable. Then start by making sure both devices are configured to allow this.
Configure devices:
- Launch Safari on your mac; open preferences and within the advanced tab click the checkbox for “Show Develop menu in menu bar”.
- Confirm, you should now see a menu called Develop in the top bar
- On your iOS device (iPhone or iPad) go to Settings > Safari > Advanced and slide the toggle on for Web Inspector.
Debug a site in Mobile Safari:
- Connect your iOS device (iPhone or iPad) to your mac
- On the device browse to your site in Mobile Safari
- On your mac’s Safari, under the Develop menu you should see an option for your iOS device (either called iPhone or iPad).
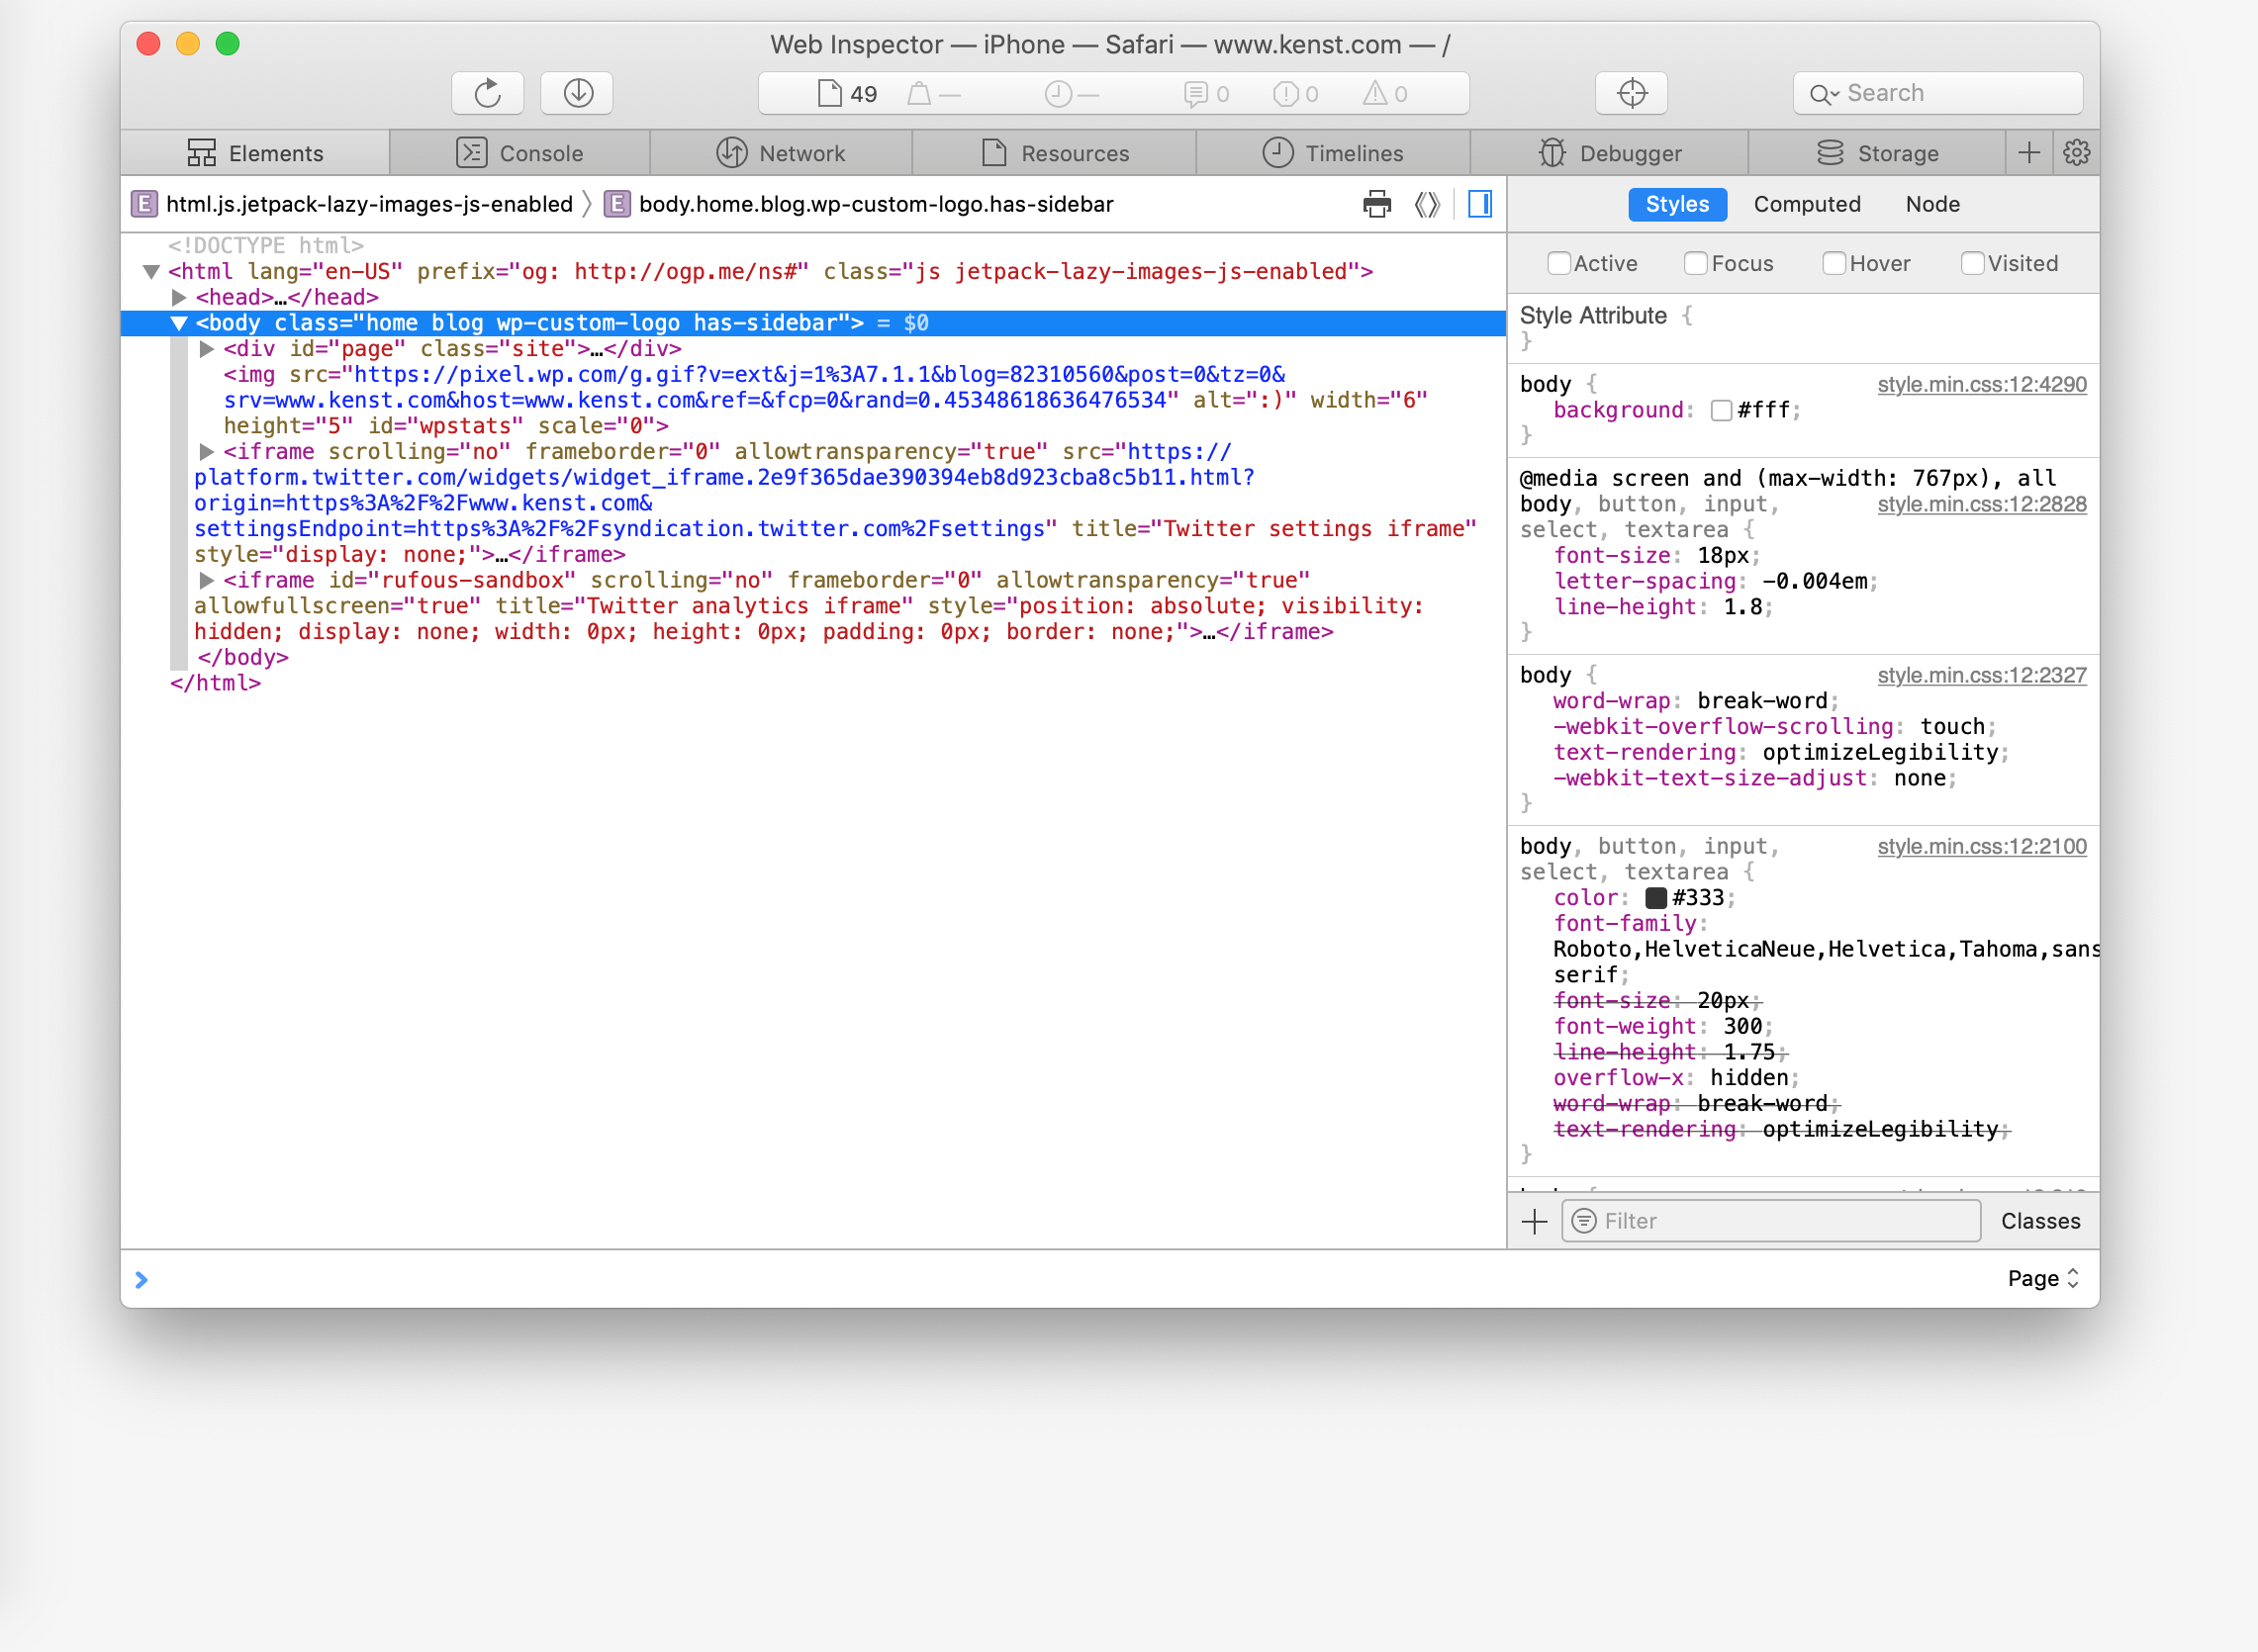
- In that sub-menu you should see the url of the website you want to debug. Click that url and it will open a new Safari window with the full Safari Dev Tools.
- Start your investigation!
A few weeks back I was testing changes to review submissions (buy a product, leave a review) and on Chrome desktop everything worked fine (including Chrome’s mobile emulator). However after testing on a real device, Safari didn’t behave the same way. Luckily we were able to debug using this same method and fix those remaining issues before any customers saw problems.
It just goes to show real device testing matters!
Oh and if this article worked for you please consider sharing it or buying me coffee!
Member discussion